
Ask an owner how many calls he misses and you tend to get a feeling, not a number: a few, not many, more than he would like. The feeling is usually built from the calls he remembers, and the calls that matter most are the ones that left no trace: the caller who hung up after four rings and dialed the next company on the list.
You can replace the feeling with a number in one week, using records you already have. This is that audit: what to log, how to score it, and what to compare it against.
The benchmark you are measuring against
A recent, published set of figures for home-service phone calls comes from Invoca’s Home Services Lead Conversion Benchmarks Report 2026, published July 2026. Its headline: “52% of callers to home services businesses speak with a person.” The report then filters out the noise: “For calls lasting longer than 15 seconds, which filters out misdials and quick hangups, the answer rate is 65%. For calls over 30 seconds, it’s 73%.”
Two more lines from the same report matter for this audit. Trades differ a lot: “Answer rates vary across home services sub-industries, ranging from 32% to 74%.” The nine it covers are carpeting, construction, doors and windows, home security, HVAC, lawn and trees, pest control, plumbing, and restoration. And not every call is a lead: “Across home services, 38% of calls answered by a person are leads, and 45% of those leads convert on the call.”
One caution. Invoca sells call-tracking software, and these are its numbers. They are named, dated and published, which is more than most figures in this industry, but the only number that tells you about your business is the one you are about to collect.
Before the week starts: fifteen minutes of setup
Pick seven days in a row that include a weekend, in a normal week, not the week of a holiday or a storm. Then find where your records already live:
Then make one sheet, on paper or in a spreadsheet, with a row for every contact and these columns:
| Column | What goes in it |
|---|---|
| When | Day and time the call, form or text came in |
| Channel | Call, form or text |
| Who | New customer, existing customer, supplier, spam or wrong number |
| Answered | Yes if a person spoke to them live; no otherwise |
| Quick hang-up | Yes if the caller hung up almost at once |
| Voicemail left | Yes or no, for the missed calls |
| First reply | When you or anyone on your side first got back to them |
| Outcome | Booked, quote sent, lost, or not a lead |
During the week: ten minutes a night
Fill the sheet each evening from the call log, the voicemail box and the form emails. Do not wait until Sunday; by then you will not remember which number was the supplier. And do not change how you work this week. You are measuring the normal week, not the week you were trying hard because you were measuring.
Mark the caller you cannot identify as unknown rather than guessing. An unknown new number that rang during working hours and never called back is exactly the kind of row this audit exists to find.
Scoring it: four numbers
1. Your answer rate. Calls answered by a person, divided by all calls that came in. Compare it with Invoca’s 52%.
2. Your answer rate on real calls. Invoca’s second figure leaves out short calls to filter out misdials and quick hang-ups. Do the same rough cut: take the quick hang-ups, the spam and the wrong numbers out of the total, then divide again. Compare it with Invoca’s 65%. It will not be a perfect match for Invoca’s method, but it is close enough to tell you whether you are in the same neighborhood.
3. Your voicemail ratio. Of the real calls you missed, how many left a message? Do not be surprised if it is almost none. Invoca’s 2024 article on missed home-service calls says its platform data shows that “less than 3% of callers who get pushed to voicemail leave a message.” That is why the voicemail box is not your missed-call count. The log is.
4. Your form reply time. For each web form, the time between the form’s timestamp and your first reply. Write down the typical one and the worst one. The worst one is the number your next customer is likely to meet.
A worked example
Say a two-truck HVAC company runs the audit and its sheet shows 84 calls in the week. A person spoke to 41 of them. That is 41 ÷ 84, or 49%: a little under Invoca’s 52% for home services.
Nine of the 84 were quick hang-ups, spam or wrong numbers. Take them out and there are 75 real calls, 41 answered: 55%, against Invoca’s 65% for calls past 15 seconds. So 34 real calls reached nobody. The voicemail box holds two messages from that week.
How many of those 34 were jobs? Nobody knows, and that is the point of the exercise. But if the missed calls carried leads at the same rate Invoca found among answered calls, 38%, that would be about 13 leads in a single week that went somewhere else. That is an assumption, not a measurement; the sheet’s “Who” column on the calls you did answer tells you whether 38% is high or low for your business.
The same week brought 11 web forms. The typical first reply came about three and a half hours after the form; the worst waited until the next morning.
What the pattern tells you
The total is the headline, but the timestamps are where the fix is. Invoca’s own advice on answer rates starts in the same place: “Call answer rates typically vary throughout the day and week.” Sort your missed calls by hour and day and one of a few patterns usually shows:
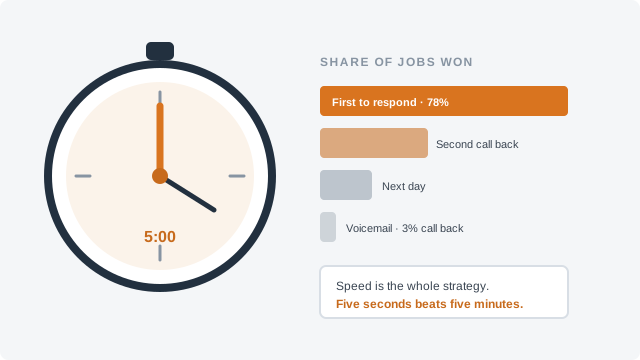
Why the speed of the reply matters as much as the answer itself is the subject of The Five-Minute Rule.
Put a dollar figure on it
Once you have the week, the arithmetic takes a minute. Take the real calls nobody answered, multiply by the share of your answered calls that were new-customer leads (the “Who” column), then by the share of leads you usually win, then by your average job.
Go back to the HVAC example and its 13 possible leads. Say the company wins about four in ten of the leads it talks to, and its average job is $600. Thirteen times 0.4 is about five jobs, and five jobs at $600 is about $3,000 of work in one week. Those inputs are made up for the example. Use the numbers from your own sheet, not the benchmark, and check one more thing while you are in it: how many of the missed numbers rang again later in the week. A caller who tried twice is one you may still win back.
Do it again in a quarter
One week is a snapshot. Run the same audit once a season, because the misses move: a roofer’s spring is not his January, and a pest-control company’s summer is not its fall. Keep the old sheets. The second audit is where you find out whether whatever you changed after the first one actually worked.
The whole thing costs about an hour and a half over a week. At the end of it you will know, instead of guessing, how many people tried to reach your business and found nobody there.